Drawing Health
Let's start with the news that reminds us of how we should not do visualizations. Georgia Department of Health decided to create a map to research the state’s public health. But something went wrong. Instead of getting a beautiful…

IMAGING & VISUALIZATION IN HEALTHCARE. WE WANT TO SEE MORE!
Let's start with the news that reminds us of how we should not do visualizations.
Georgia Department of Health decided to create a map to research the state’s public health. But something went wrong. Instead of getting a beautiful visualization & analytics tool, the local authorities got this:
Oleg Pun
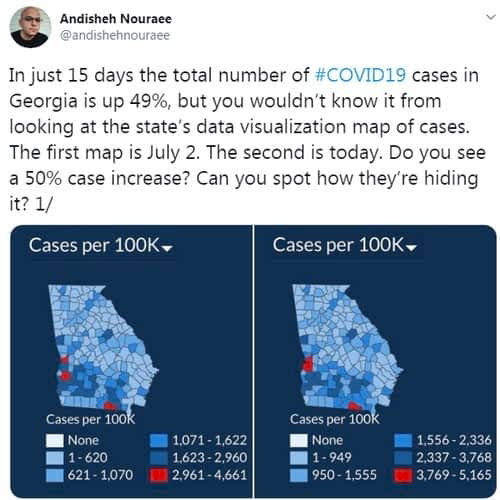
Source: Andishen Nouraee's twitter
You can guess why this has happened: colors. Colors and their mix are extremely important in designers' work, and data visualization is not an exception. When you try to visualize large sets of data, probably you shouldn't explore 50 similar and mostly identical shades of ‘blues’ and ‘reds’. Instead, think about more complex color schemes that will show your customers clearly what's going on.
GDH stated lately they are going to update the visualizations, I wish they would.
To compare, see a couple of cool projects dedicated to COVID research visualizations.
The first is a project of OCHA released on July 30. OCHA created a map to understand how the virus progresses and affects vulnerable people in 63 countries. Those countries have a refugee or humanitarian operation. You can read more about the reasons OCHA created the map here and see the map itself.
The other project visualizing COVID-19 spreading is a Koronamonitor. The project made by Hungarian journalists. There are no maps, instead — a dozen graphs that show all the information you need to know about the state of affairs. Read more about the story of these journalists on Poynter here.
Aside from the coronavirus topic, two fresh projects are connected to imaging, visualization, and analytics in healthcare and inspired me to write this blog.
First of them is the digital Encyclopedia of DNA Elements that's going to explain how the human genome works. This is the third stage of the project and ENCODE 3 researchers created a web-based tool — SCREEN — that allows users to visualize the data supporting the project’s interpretations. Read more about the project here.
The second example is more about imaging than visualizing. But who knows, maybe visualizing of data collected will be the next step in this project? I'm talking about optical coherence tomography endoscope — the world's smallest imaging device! And it's 3D printed. It has a diameter of 0.46 millimeters and, surely, will have large implications in cardio care. You can read more about this project here.
This is a great example of cooperation between medics and engineers. I'm sure, healthtech need to be added here. The technology can help this project to collect data, study it, analyze correlations between different data sets, interpret it correctly, and build great visualizations based on these researches.
I'm sure, there are many more visualizations I didn't manage to see yet. Which of them inspired you more? I will appreciate if you share your thoughts.
Originally published on vareger.com.
Co-founder and CEO of Vareger. CTO of Stablerail; co-founder and CTO of Pitchbreeze.
More about the Vareger Group team